Scaling a plumbing business isn’t just about taking more jobs; it’s about making data-driven decisions that improve profitability, technician productivity, and customer satisfaction.
By tracking the right KPIs (Key Performance Indicators), plumbing business owners can identify bottlenecks, optimise scheduling, pricing, and marketing, and make confident growth decisions.
In this guide, you’ll learn financial, operational, customer, and marketing KPIs tailored for UK plumbing firms, complete with formulas, examples, and practical improvement tests.
We’ll also explore how software like Trade‑Linked automates KPI tracking, turning numbers into actionable insights so you can spend less time crunching spreadsheets and more time growing your business.
Key Takeaways
- Tracking financial KPIs, such as gross margin, net margin, and break-even revenue, helps plumbing businesses stay profitable and make informed pricing and hiring decisions.
- Monitoring operational KPIs like job completion rate, first-call resolution, and technician utilisation improves productivity and highlights workflow issues.
- Increasing revenue per technician through efficient scheduling, better route planning, upsells, and accurate quotes boosts overall business performance.
- Measuring customer metrics such as acquisition cost, lifetime value, and retention ensures growth is both profitable and sustainable.
- Improving customer retention with service reminders, loyalty programs, and post-job follow-ups increases repeat business and reduces marketing costs.
- Regularly reviewing KPIs and assigning clear responsibility for each metric allows plumbing businesses to turn data into actionable decisions.
- Using integrated software to manage job tracking, CRM, scheduling, and invoicing simplifies KPI monitoring and enhances operational efficiency.
What Are the Most Important Financial Metrics to Track for Plumbing Business Growth?
Financial KPIs help you see how profitable your business is and whether you can reinvest. Gross profit margin, net profit margin, and break-even revenue show how each job performs, how healthy your business is overall, and how much you need to sell to cover your fixed costs.
By checking these numbers often, you can spot issues like pricing problems, rising costs, or when it’s time to hire. This helps you focus on setting the right prices, securing better deals from suppliers, and maximising the effectiveness of your team.

How to Calculate Gross Profit Margin
Gross profit margin shows how much money from each job is left after paying for materials and labour. This leftover amount goes toward your overhead and profit. To calculate it, subtract material and labour costs from your revenue, then divide that number by your revenue to get a percentage. This tells you how well you’re pricing jobs and controlling costs.
For example, if you charge £400 for a repair and spend £220 on direct costs, your gross margin is 45%. This margin can cover your overhead if you keep other expenses under control.
You can improve your gross margin by costing jobs accurately, negotiating better prices with suppliers, and reducing wasted or unbilled labour time.
Maintaining a Good Net Profit Margin
The net profit margin indicates how much the business retains after covering overheads, taxes, and interest, which is a key indicator of long-term health and reinvestment capacity.
A healthy small plumbing business in the UK usually aims for net margins of about 10% to 20%. If your margin is below 10%, it may mean your overhead is too high or your prices are too low.
Each month, review your accounts to separate job costs from overheads like office expenses, insurance, and marketing. Then, look for ways to cut costs or adjust prices to reach your target margin.
To raise your net margin, consider increasing the workload of your team, reducing fixed costs, or selling more add-ons and service plans. These steps work best when you also make changes that help your technicians work more efficiently.
How Can Break-Even Analysis Help Your Plumbing Business?
Break-even analysis shows how much revenue you need to cover your fixed costs at your current gross margin.
This is important when making decisions about hiring, pricing, and investments. Use the formula: Break-even revenue = Fixed costs divided by gross margin percentage.
Try out scenarios, like hiring another technician or raising prices by 5%, to see how your break-even point changes.
For example, if you add £2,000 in monthly fixed costs and have a 45% gross margin, your break-even revenue goes up by about £4,444. This helps you see if you have enough demand to support the hire.
By running scenario tests regularly, you can avoid hiring too soon and make price changes based on real data. Automated reporting tools can help you do these tests each month so your decisions stay data-driven.
Operational Efficiency KPIs that Drive Plumbing Business Performance
Operational KPIs help you measure how scheduling, parts management, and technician actions impact your margins and customer experience. Metrics like job completion rate, first-call resolution, average response time, and technician utilisation reveal workflow issues and training needs.
When you improve these KPIs, you increase revenue per technician and lower costs. Checking these metrics each week helps you spot problems like inefficient routes, missing stock, or skill gaps.
You can then test solutions such as better route planning or using pre-packed parts kits to boost productivity.
Here is a quick comparison of key operational KPIs, including formulas and practical tips to improve them.
| Job completion rate | Completed jobs / Scheduled jobs (%) | Better parts planning, technician training, and real-time updates |
| Revenue per technician | Total revenue / Number of techs | Route efficiency, upsell training, and improved scheduling |
| Technician utilisation | Billable hours / Paid hours (%) | Cut travel time, cluster jobs, and improve dispatching |
How to Measure Job Completion Rate and Improve Technician Productivity?
Job completion rate measures the percentage of scheduled jobs finished as planned. It is a key sign of reliability and customer satisfaction. To calculate it, divide completed jobs by scheduled jobs for a set period. Track reasons for jobs not finished so you can address common issues like missing parts or changes in job scope.
You can boost productivity by using standard kit lists, offering focused training, and keeping better control of inventory. These steps help cut down on repeat visits and emergency call-outs.
Conducting a quick daily check of open jobs and parts status helps you identify at-risk work and avoid unnecessary travel. This leads to higher completion rates and happier customers.
When you raise completion rates, you also improve first-call resolution and reduce revenue lost to rework.
What Is Revenue Per Technician and How Can You Increase It?
Revenue per technician indicates how effectively your team converts work into income. To find it, divide your total revenue by the number of active technicians for the same period.
You can increase this number by making better use of your technicians’ time, reducing non-billable hours, and increasing the average job value through upsells, maintenance plans, and more accurate quotes.
Try grouping similar jobs together, training technicians to spot add-on opportunities, and setting daily revenue goals with coaching.
Compare revenue per technician with your scheduling and travel data to find out if your main challenges are demand, routing, pricing, or skills.
As revenue per technician increases, your net margins usually grow too. This gives you more resources to invest in marketing or hiring more staff.
How Can Customer-Centric Metrics Boost Your Plumbing Business Growth?
Customer metrics such as customer acquisition cost (CAC), customer lifetime value (CLV), and retention rate help you see if your growth is both profitable and sustainable. CAC tells you how much you spend on marketing and sales to get a new customer. CLV shows how much revenue a customer brings in over time.
The ratio of CLV to CAC is a simple way to measure how well your marketing is working. Retention increases CLV because repeat customers are less expensive to serve and often choose higher-value services.
What Is Customer Acquisition Cost and How to Reduce It?
Customer acquisition cost is your total marketing and sales spend divided by the number of new customers in the same period. This tells you how much you pay for each new client. To work out CAC, add up your spending on each channel and sales hours, then divide by the number of new customers.
For UK plumbing businesses, CAC can vary a lot between SEO, PPC, and referrals, so track each channel separately. You can lower CAC by making your website convert better, targeting ads more precisely, improving local reviews, and focusing on referrals.
Using a CRM to track leads and automate follow-ups helps cut wasted spending and boosts your close rates, which lowers CAC over time.
Reducing CAC increases your marketing ROI and lets you spend more on the channels that deliver the best results.
Customer Lifetime Value and Why It Is Important
Customer lifetime value is an estimate of how much revenue a customer brings in over their time with your business. Usually, you calculate it as average transaction value times how often they buy, times how long they stay, minus service costs.
For example, if the average job is £180, a customer books 1.5 jobs a year, and stays for 4 years, that’s £1,080 before costs. Knowing your CLV helps you decide how much you can spend to get a new customer. You can raise CLV by offering service plans, proactive maintenance, and targeted upsells.
This boosts your marketing returns and means you don’t have to chase low-value leads. When your CLV is much higher than your CAC, you can grow your business profitably.
Customer Retention Rate Critical for Plumbing Businesses
Retention rate shows the percentage of your customers who come back over a certain period. This has a big impact on your profits because returning customers are cheaper to serve and often spend more.
To measure retention, track how many customers return over 12 months and compare different groups to find where you might be losing people, such as after slow follow-up or weak communication after a job.
You can improve retention with scheduled maintenance reminders, loyalty discounts, and post-job surveys that encourage reviews. These steps help you build steady repeat business and get more referrals.
Even a small increase in retention can raise your CLV and reduce the need for expensive marketing campaigns.
Focus on retention every month by using CRM workflows and automated reminders to keep in touch with your customers.

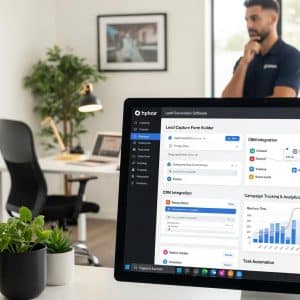
How Trade‑Linked Software Helps Track and Improve Plumbing Business KPIs
Trade‑Linked brings job management, CRM, scheduling, and invoicing into a single, unified platform, making it much easier to monitor key performance indicators from one place.
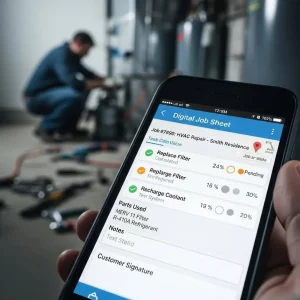
Accurate Job Costing and Reporting
Technicians can use mobile job capture to log hours, materials, and signatures while on-site, which helps ensure job costs are accurate. This information goes straight into reports and invoices, cutting down on manual work and mistakes.
With Trade‑Linked, you can quickly see reports on each job’s profit, material and labour costs, and revenue trends. This helps you spot your most profitable jobs and find ways to work more efficiently.
CRM for Customer Insights and Lead Tracking
Trade‑Linked’s built-in CRM keeps customer details, job history, and lead sources together. This helps plumbing businesses track customer activity and repeat business more easily.
While Trade‑Linked does not calculate marketing ratios for you, it gives you the accurate data needed to measure customer acquisition, retention, and repeat value.
By having all customer information in one place, you can make better decisions about marketing and service plans, and keep every interaction connected to job records.
Scheduling and Technician Efficiency
Trade‑Linked’s scheduling tools help you organise jobs, routes, and teams more efficiently.
When you track job progress, labour hours, and materials in the system, you can see how well technicians are being used and how efficient your operations are. Accurate job costing and better scheduling can cut down on travel time, boost first-time job completion, and show which job types or areas need improvement.
These changes lead to better service and a clearer view of your key performance indicators.
What Are the Best Practices for Monitoring Plumbing KPIs Regularly?
Best practice is clear ownership for each KPI, short actionable reports for technicians and richer dashboards for managers and owners.
Daily views should show billable hours, open jobs and parts shortages; weekly reports focus on completion rates and revenue per technician; monthly reviews reconcile the books and test break‑even scenarios.
Set threshold alerts for critical KPIs, e.g., gross margin below target, to trigger quick investigation and corrective action. Regular cadence plus ownership turns KPIs into operational tools, not just numbers on a spreadsheet.
These habits convert data into decisions and build a culture of measurable progress.
How to Set Realistic Growth Targets Using Plumbing Industry Benchmarks?
Set targets by choosing the right benchmarks, gross margin, net margin and conversion rates, and adjust for your size, service mix and local pricing to create realistic monthly and quarterly goals.
Break annual targets into weekly per‑technician revenue and conversion targets, then run small experiments to validate assumptions before scaling. Simple worksheets convert benchmarks into per‑tech, per‑day objectives and let you track progress against those micro‑targets each week.
When targets are grounded in benchmark‑adjusted reality, experiments become manageable and growth measurable.
To act now, use automated reporting and scenario tools to stress‑test targets and consider joining the waitlist or watching a demo to see how Trade‑Linked automates these workflows.
Frequently Asked Questions
What are the key benefits of using Trade-Linked software for plumbing businesses?
Trade‑Linked brings together job management, CRM and accounting into one place, so KPI tracking is automatic and reliable. That means less time on spreadsheets, faster insight into profit by job and clearer operational visibility.
With automated reporting, you spot trends and issues earlier, freeing you to focus on growth and customer experience rather than admin.
How can plumbing businesses improve their customer retention rates?
Improve retention by staying in touch: scheduled maintenance reminders, simple service plans, loyalty offers, and post‑job follow‑ups work well.
Delivering consistently good service and resolving issues quickly builds trust, and satisfied customers return and refer others. Automating reminders and renewals with a CRM ensures a reliable process.
What role does technician training play in improving operational KPIs?
Technician training is vital. Better skills mean faster jobs, fewer repeat visits and more confidence to offer add‑ons, which lifts job completion rates and revenue per technician.
Training should cover technical skills, customer service and simple upsell techniques. Regular coaching turns small improvements into measurable gains.
How can plumbing businesses effectively measure their marketing ROI?
Measure marketing ROI by comparing the revenue attributed to campaigns against their costs: ROI = (Attributed revenue – Marketing cost) / Marketing cost.
Use a pragmatic attribution model and tie campaign costs to first‑party sales data. That lets you see which channels deliver real CLV‑adjusted returns and reallocate budget accordingly.
What are some common pitfalls to avoid when tracking plumbing business KPIs?
Common mistakes include unclear KPI ownership, stale data and irregular reviews. Don’t use generic benchmarks without adjusting for your size and mix. Make KPIs actionable, set alerts for critical thresholds and keep a regular cadence of review. Those habits stop KPIs from becoming meaningless and turn them into decision tools.
How can plumbing businesses leverage customer feedback to enhance their services?
Collect feedback via short surveys, review invites and follow‑up calls, then act on common issues. Use positive reviews in marketing and share learnings from negative feedback with the team. Responding visibly to feedback shows customers you care and helps improve service, which boosts retention and referrals.
Conclusion
Growing a plumbing business takes more than doing more jobs. You need data to guide your decisions. By tracking financial, operational, customer, and marketing KPIs, owners can spot inefficiencies, adjust pricing and scheduling, and make smart choices for growth.
Tracking metrics like profit margins, break-even revenue, job completion rates, technician use, and customer lifetime value gives you useful insights into your business. With tools like Trade‑Linked, you can track these KPIs automatically and use the data to make decisions that boost profits, efficiency, and customer satisfaction.
In the end, businesses that regularly track, review, and use KPI data set themselves up for ongoing improvement. This helps cut down on wasted time, raise revenue per technician, improve customer experience, and support steady, long-term growth.